Sahil Hansalia, a campus junior, takes the 51B bus every day to get to class. In the morning, he checks the Transit app on his phone to see when the next bus will arrive. Today, the app predicts the bus will come in 10 minutes. He knows he has a few minutes before he has to leave his apartment.
Most of the time, the prediction is accurate. But some days, it changes. He checks the app five minutes later and sees that the predicted arrival time has increased to 12 minutes.
He decides to walk to campus instead.
“I’d say 20 percent of the time, (the prediction) gets pushed back,” Hansalia said. “It’s annoying.”
Instead of publishing a schedule for each stop on each bus route, AC Transit recommends passengers rely on real-time predictions provided by NextBus, a company that partners with transit agencies to provide vehicle departure predictions. AC Transit collects GPS data from its buses and sends the information to NextBus, which predicts when the next bus will arrive at each stop by taking traffic patterns into account.
NextBus’ predictions are available on AC Transit’s website, the NextBus app and the Transit app. We wanted to measure how often those predictions — which AC Transit recommends on its website as a way for passengers to “manage (their) time more efficiently” — are accurate.

Since most stops don’t have a published schedule, we measured the gap between when the NextBus service says a bus is 20 minutes away from a stop and when it actually gets there according to the service.
Let’s say you’re at the Bancroft Way and Telegraph Avenue bus stop.

You open the NextBus app at 3:40 p.m. The app shows that the next bus will arrive in 20 minutes, or at 4 p.m. Start a stopwatch.
Let’s say the bus arrives as predicted at 4 p.m. Record it as zero minutes late.
If instead the bus arrived at 4:12 p.m., you would record it as 12 minutes late.
–20
–10
0
+10
+20
Minutes off from prediction

You open the NextBus app at 3:40 p.m. The app shows that the next bus will arrive in 20 minutes, or at 4 p.m. Start a stopwatch.
Let’s say the bus arrives as predicted at 4 p.m. Record it as zero minutes late.
If instead, the bus arrived at 4:12 pm, you would record it as 12 minutes late.
–20
–10
0
+10
+20
Minutes off from prediction
Using this approach, The Daily Californian monitored more than 45,000 trips for 20 bus routes at 80 stops near campus in September and October. We collected data showing which stops and routes have arrival predictions that don’t always come true.
[Explore the data for your bus stop]
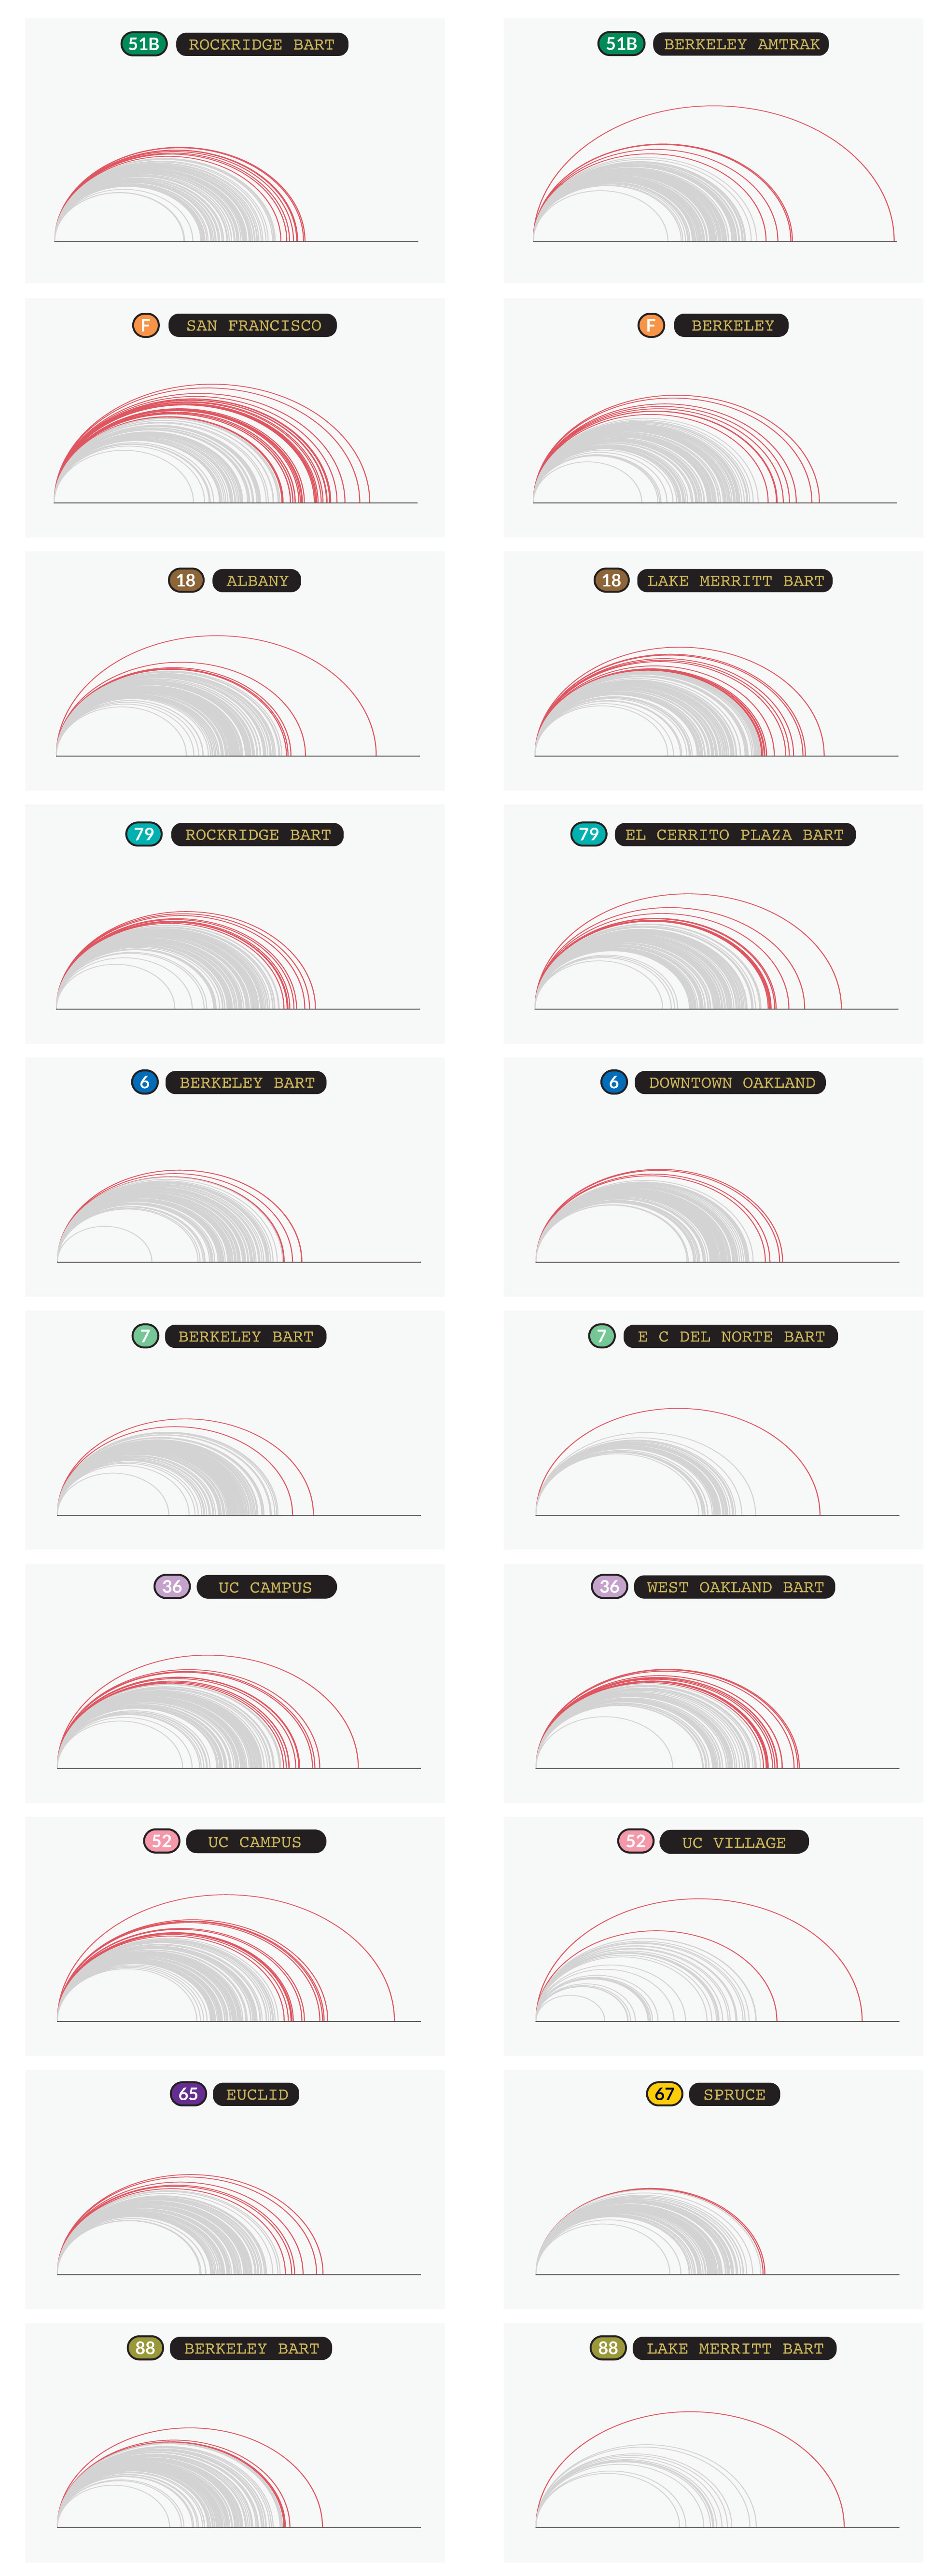
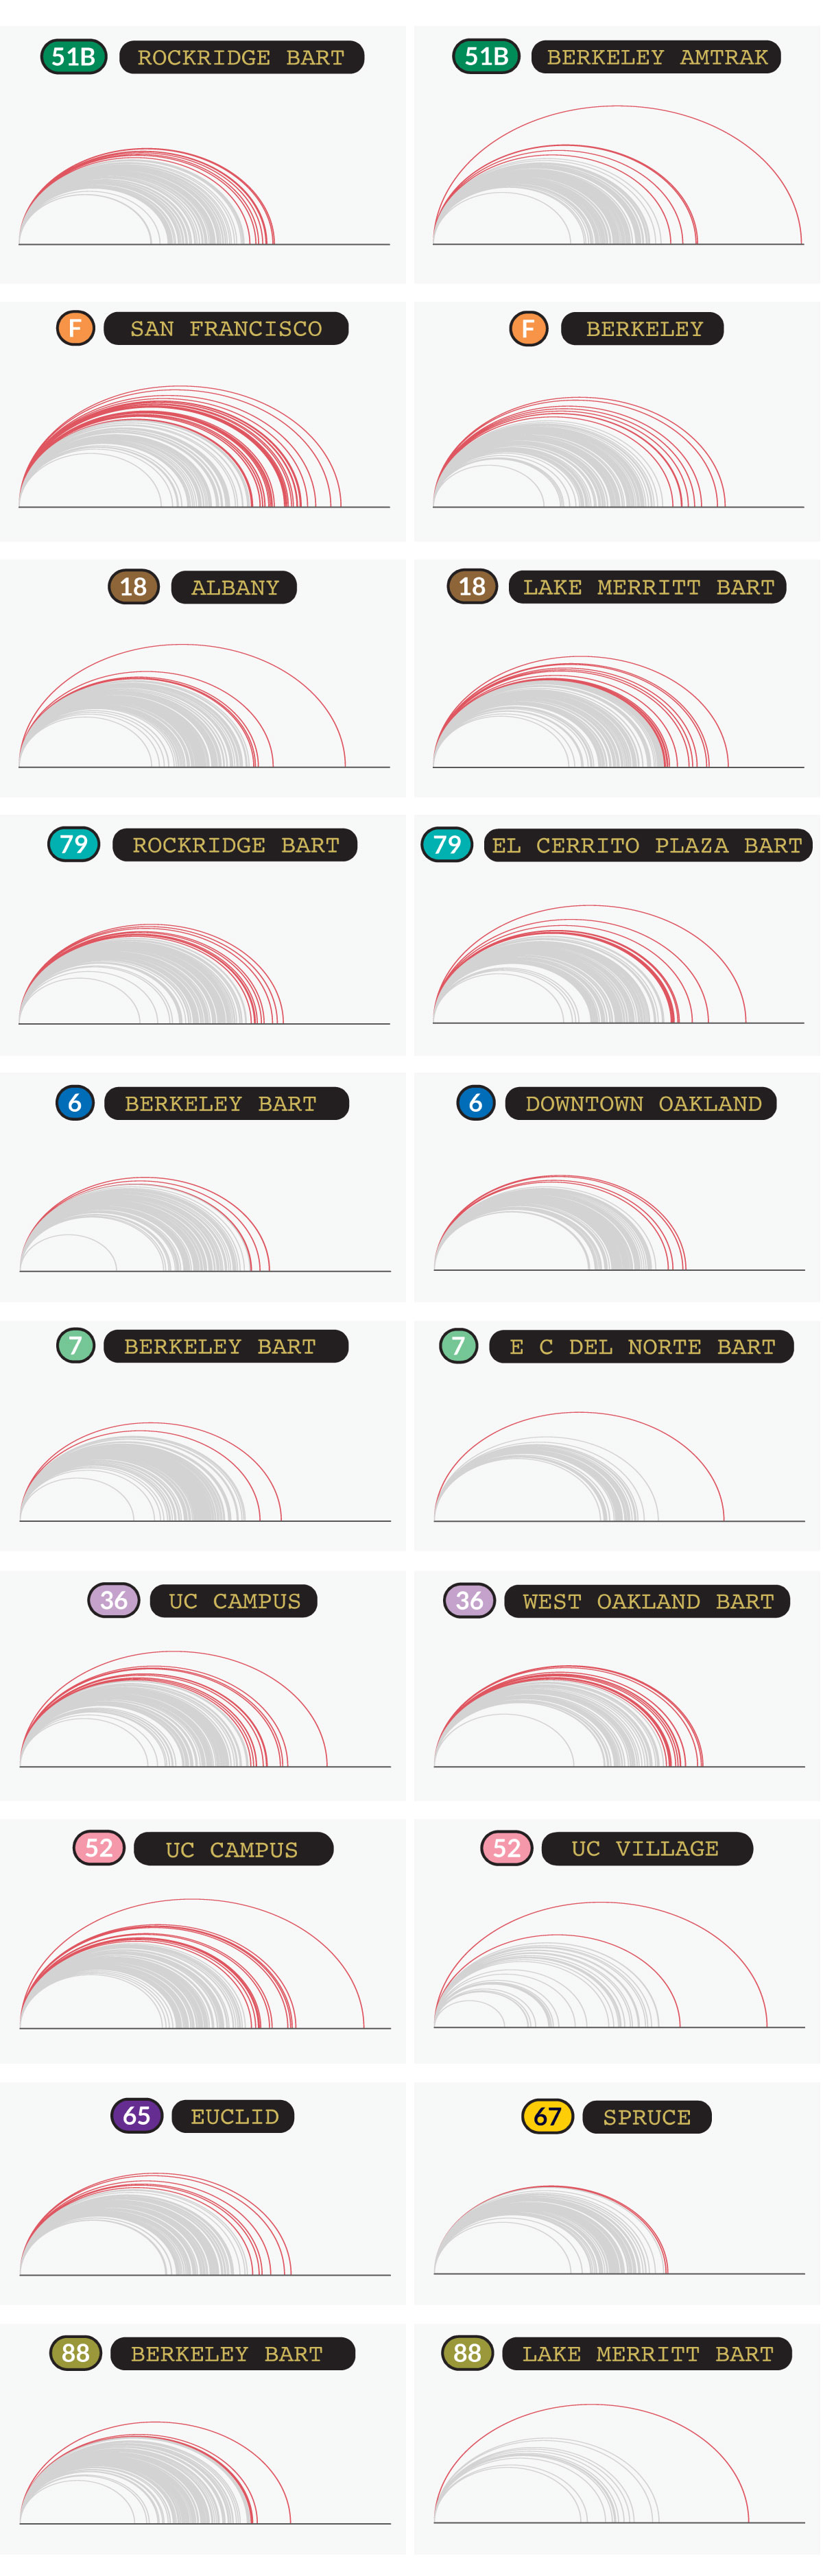
Below, each chart shows a selection of 100 trips on a route, along with the proportion that arrived more than five minutes later than predicted, which we considered to be “late.” Each arc represents one bus trip, starting 20 minutes before the bus is expected to arrive.
8
5
in 100 trips were late
in 100 trips were late
–20
–10
0
+10
+20
–20
–10
0
+10
+20
Minutes off from prediction
30
8
in 100 trips were late
in 100 trips were late
–20
–10
0
+10
+20
–20
–10
0
+10
+20
5
13
in 100 trips were late
in 100 trips were late
–20
–10
0
+10
+20
–20
–10
0
+10
+20
9
12
in 100 trips were late
in 100 trips were late
–20
–10
0
+10
+20
–20
–10
0
+10
+20
5
4
in 100 trips were late
in 100 trips were late
–20
–10
0
+10
+20
–20
–10
0
+10
+20
2
1
in 100 trips were late
in 100 trips were late
–20
–10
0
+10
+20
–20
–10
0
+10
+20
11
15
in 100 trips were late
in 100 trips were late
–20
–10
0
+10
+20
–20
–10
0
+10
+20
12
2
in 100 trips were late
in 100 trips were late
–20
–10
0
+10
+20
–20
–10
0
+10
+20
6
2
in 100 trips were late
in 100 trips were late
–20
–10
0
+10
+20
–20
–10
0
+10
+20
6
1
in 100 trips were late
in 100 trips were late
–20
–10
0
+10
+20
–20
–10
0
+10
+20
5
8
in 100 trips were late
in 100 trips were late
–20
–10
0
+10
+20
–20
–10
0
+10
+20
Minutes off from prediction
30
8
in 100 trips were late
in 100 trips were late
–20
–10
0
+10
+20
–20
–10
0
+10
+20
5
13
in 100 trips were late
in 100 trips were late
–20
–10
0
+10
+20
–20
–10
0
+10
+20
9
12
in 100 trips were late
in 100 trips were late
–20
–10
0
+10
+20
–20
–10
0
+10
+20
5
4
in 100 trips were late
in 100 trips were late
–20
–10
0
+10
+20
–20
–10
0
+10
+20
2
1
in 100 trips were late
in 100 trips were late
–20
–10
0
+10
+20
–20
–10
0
+10
+20
11
15
in 100 trips were late
in 100 trips were late
–20
–10
0
+10
+20
–20
–10
0
+10
+20
12
2
in 100 trips were late
in 100 trips were late
–20
–10
0
+10
+20
–20
–10
0
+10
+20
6
2
in 100 trips were late
in 100 trips were late
–20
–10
0
+10
+20
–20
–10
0
+10
+20
6
1
in 100 trips were late
in 100 trips were late
–20
–10
0
+10
+20
–20
–10
0
+10
+20

8
in 100 trips were late
–20
–10
0
+10
+20
Minutes off from prediction
5
in 100 trips were late
–20
–10
0
+10
+20
30
in 100 trips were late
–20
–10
0
+10
+20
8
in 100 trips were late
–20
–10
0
+10
+20
5
in 100 trips were late
–20
–10
0
+10
+20
13
in 100 trips were late
–20
–10
0
+10
+20
9
in 100 trips were late
–20
–10
0
+10
+20
12
in 100 trips were late
–20
–10
0
+10
+20
5
in 100 trips were late
–20
–10
0
+10
+20
4
in 100 trips were late
–20
–10
0
+10
+20
2
in 100 trips were late
–20
–10
0
+10
+20
1
in 100 trips were late
–20
–10
0
+10
+20
11
in 100 trips were late
–20
–10
0
+10
+20
15
in 100 trips were late
+10
+20
–20
–10
0
12
in 100 trips were late
+10
+20
–20
–10
0
2
in 100 trips were late
–20
–10
0
+10
+20
6
in 100 trips were late
–20
–10
0
+10
+20
2
in 100 trips were late
–20
–10
0
+10
+20
6
in 100 trips were late
–20
–10
0
+10
+20
1
in 100 trips were late
–20
–10
0
+10
+20
In the time period we monitored, almost one-third of the arrivals at any stop along the F bus to San Francisco were later than predicted by more than five minutes. The 18 bus to Lake Merritt BART Station was relatively unpredictable as well.
Other buses, such as the 7 bus to Berkeley BART Station, arrived as predicted more often. The 51B to Berkeley Amtrak arrived more than five minutes later than predicted only 5 percent of the time.
Erika Kodera, a campus senior who takes the 51B bus “at least twice a day” because she has class across campus, said the predictions are “pretty accurate” and have gotten better since she started using the NextBus app more than a year ago.
The spread in delay time varied, too. Arrivals for the 7 bus to El Cerrito del Norte BART Station were tightly clustered, but the 52 bus to UC Village, while rarely more than 5 minutes late, saw more varied delay times and often came before it was predicted to arrive.
Michael Medford, a campus graduate student who said the service doesn’t give accurate times for the 52 bus, said he thought the unpredictability might be because of construction starting late in the morning.
“It’s a crapshoot after 10 a.m.,” he said.
We also found predictions were less accurate in the evening, especially for popular lines such as the 18 and 51B buses.
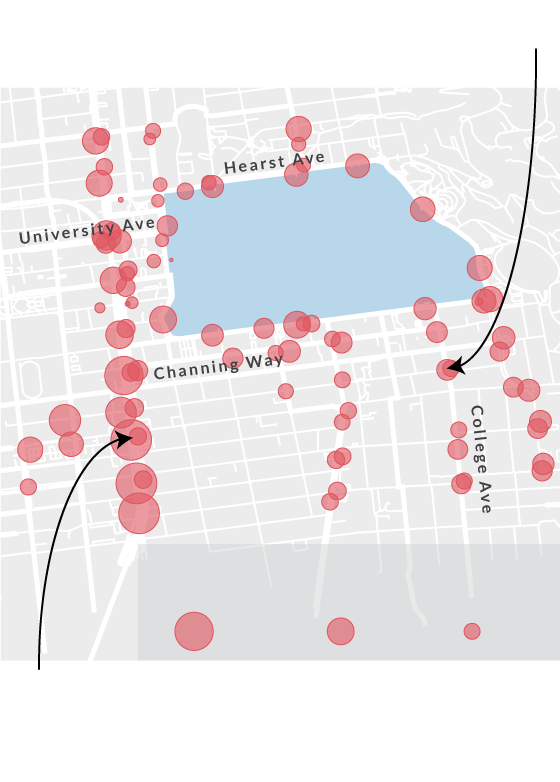
Where delays are most frequent
We analyzed delayed trips at each stop and found delays clustered along southbound Shattuck Avenue and southbound Piedmont Avenue. Buses arrived later than predicted at stops along Bancroft Way and Telegraph Avenue as well.
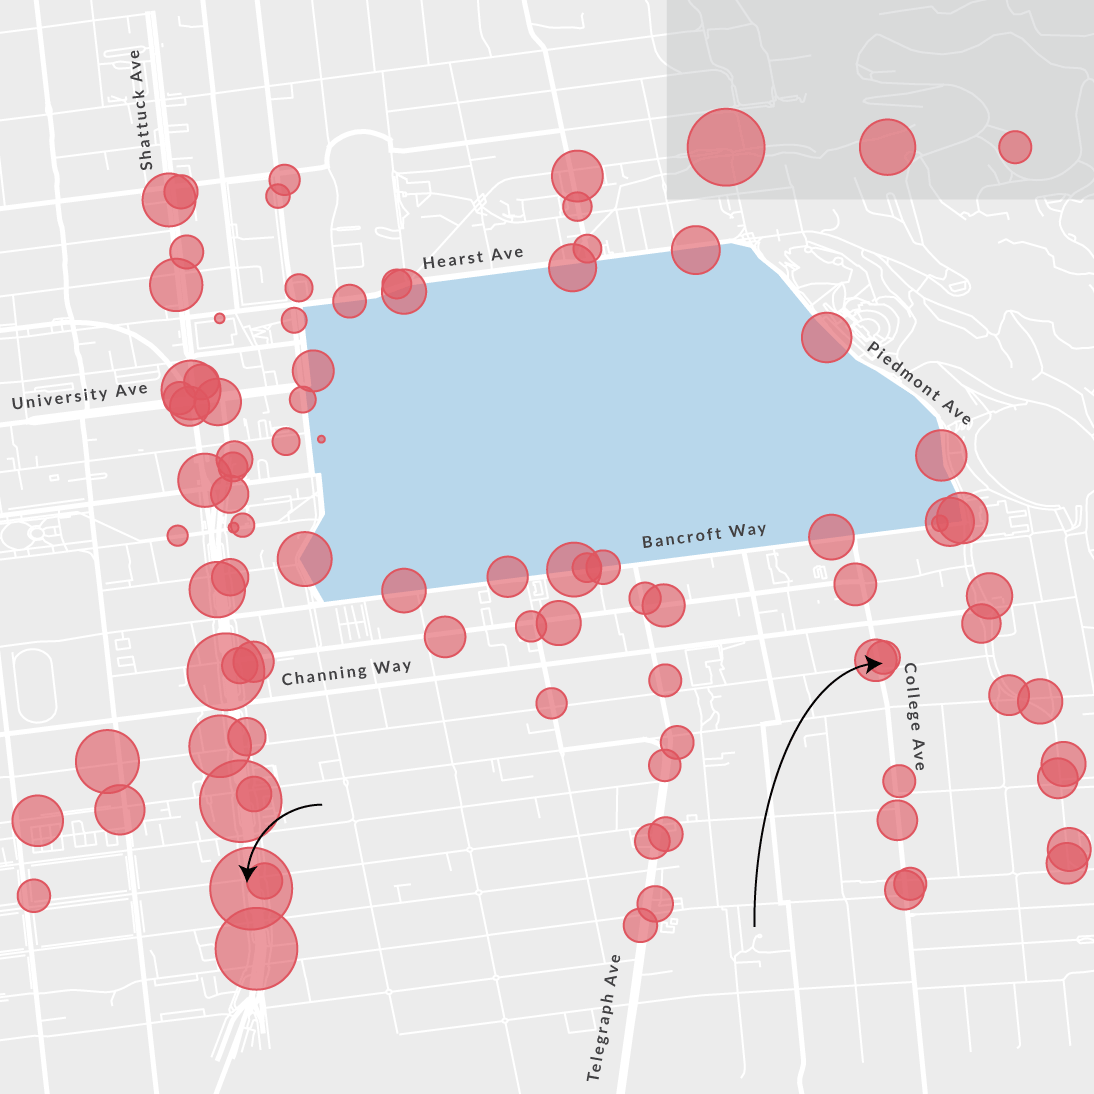
Percentage of trips that arrive more than 5 minutes later than predicted
30%
15%
5%
UC Berkeley
Stops along Shattuck Avenue for southbound buses experience significant delays (up to one-third of trips)
Stops along the 51B to Berkeley Amtrak experience few delays
Stops along the 51B to Berkeley Amtrak experience few delays
UC Berkeley
Percentage of trips that arrive more
than 5 minutes later than predicted
30%
15%
5%
Stops along Shattuck Avenue for southbound buses experience significant delays (up to one-third of trips)
According to Tony Gale, the general manager of NextBus, predictions are affected by three factors: bus operators deviating from their schedules, inconsistent tracking data and otherwise unpredictable behavior, such as detours and atypical traffic.
“The vehicle must be predictable in order for a prediction to be generated,” Gale said in a statement.
Currently, the locations of AC Transit buses are recorded and sent to NextBus about every two minutes, according to A.J. Martin, a transportation planner at AC Transit. Soon, an upgrade to the tracking technology will enable AC Transit to record and transmit location data every 30 seconds, he said.
AC Transit considers a bus “on time” if it arrives less than five minutes late, but no more than one minute early. It aims for its buses to achieve this standard 72 percent of the time. Currently, it is not meeting that goal, according to Martin.
According to its website, AC Transit buses were on time 66 percent of the time on weekdays in September 2014.
An internal task force meets monthly to address problematic routes, Martin added, and considers measures to improve timeliness. These include finding ways for buses to jump the queue at traffic lights, establishing “transit-only lanes” that give buses priority and installing devices that enable buses to extend the duration of a green light.
NextBus monitors the accuracy of its predictions for each line and stop, but it has a tighter bound than the Daily Cal for determining prediction accuracy. While we evaluated the accuracy of predictions when the bus is 20 minutes away from a stop, NextBus evaluates predictions at 5 or 10 minutes away, according to Gale.
Predictions usually get more accurate as the bus gets closer to a stop. Mark Lescroart, a campus visiting scholar, said he uses the NextBus app daily, but when he’s waiting for a bus, he has to periodically check to see if the prediction has updated.
“It’s accurate enough to be worth using,” he said. “But not (enough) to rely on it.”
Explore stops and routes nearby
We recorded predicted and actual arrivals at stops near campus for 11 lines from 5 a.m. to midnight. Below, you can explore the data for each stop. Enter a bus route and a direction, then click on a stop to view its data.
Stops that have been temporarily changed because of construction do not have accurate predictions, so we excluded them from the map.
Choose a bus line.
Choose a direction.
About this story
We polled the NextBus API for real-time bus arrival predictions, and we observed that the predicted arrival time tended to change as a bus approached a stop. We estimated when each bus arrived at each stop by requesting data every minute until the prediction disappeared. This estimated arrival was compared to the predicted arrival — the arrival time when the bus is 20 minutes away from a stop, according to the service. Stop locations are from the NextBus API.
A bus was considered “late” if its actual arrival time was more than five minutes later than the predicted time. The NextBus service predicts when a bus will “depart” from a stop. Because bus arrival and departure times are usually very close, we use the terms interchangeably in this article.
The route explorer was built with OpenLayers, an open-source library for creating dynamic maps. To draw bus routes, we used Google Maps to search for bus paths, which we converted into GPX data. The base map is from Carto.
This project is open-source on GitHub.
Sahil Chinoy contributed to this story.
Support us
We're a nonprofit, student-run newsroom. Please consider donating to support our coverage.